
- Business intelligence (BI) systems- are information systems that process operational, social, and other data to identify patterns, relationships, and trends for use by business professionals and other knowledge workers.
- Business intelligence- Are the patterns, relationships, trends, and predictions.
- BI application- The software component of a BI system.

How Do Organizations Use BI?

- Project Management
- Problem Solving
- Deciding
- Informing
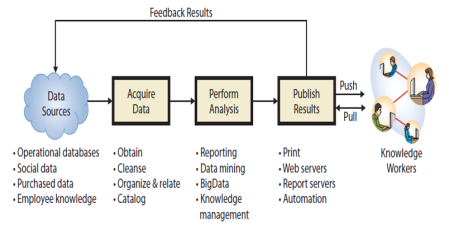
What Are the Three Primary Activities in the BI Process?
- Data acquisition- is the process of obtaining, cleaning, organizing, relating, and cataloging source data.
- BI analysis- is the process of creating business intelligence.
- Four Fundamental Categories
- Reporting
- Data Mining
- BigData
- Knowledge Management
- Publish results- is the process of delivering business intelligence to the knowledge workers who need it.
- Push publishing- delivers business intelligence to users without any request from the users; the BI results are delivered according to a schedule or as a result of an event or particular data condition.
- Pull publishing- requires the user to request BI results
- Publishing media include print as well as online content delivered via Web servers, specialized Web servers known as report servers, and BI results that are sent via automation to other programs.
How Do Organizations Use Data Warehouses and Data Marts to Acquire Data?
- Data warehouse- is a facility for managing an organization's BI data.
- Functions
- Obtain Data
- Cleanse Data
- Organize and Relate Data
- Catalog Data
- Data mart- is a data collection, smaller than the data warehouse, that addresses the needs of a particular department or functional area of the business.
 |
| Components of a Data Warehouse |
Possible Problems with Operational Data


- Data broker/ Data aggregator- a company that acquires and purchases consumer data and other data from public records, retailers, Internet cookie vendors, social media trackers, and other sources and uses it to create business intelligence that it sells to companies and the government.
- Prominent Data Brokers
- Datalogix
- Acxiom Corporation
- Federal law provides strict limits on gathering and using medical and credit card, meanwhile other data is unlimited.
- In theory, data brokers enable you to view the data is stored about you.
- In practice, it is difficult to learn how to request your data.

- Granularity- a term that refers to the level of detail represented by the data.
- It is possible to capture the customer's clicking behavior in what is termed clickstream data.
- Great- to study consumer behavior
- Bad- it can be overwhelming data if all an organization wants to know is track consumer behavior, millions and millions of clicks will have be to thrown away.

How Do Organizations Use Reporting Applications?
- Reporting application- is a BI application that inputs data from one or more sources and applies reporting operations to that data to produce business intelligence.
- Five Reporting Operations
- Sorting
- Filtering
- Grouping
- Calculating
- Formatting
- RFM analysis- a technique readily implemented with basic reporting operations. It is used to analyze and rank customers according to their purchasing patterns.
- Considers how recently (R) a customer has ordered, how frequently (F) a customer ordered, and how much money (M) the customer has spent.

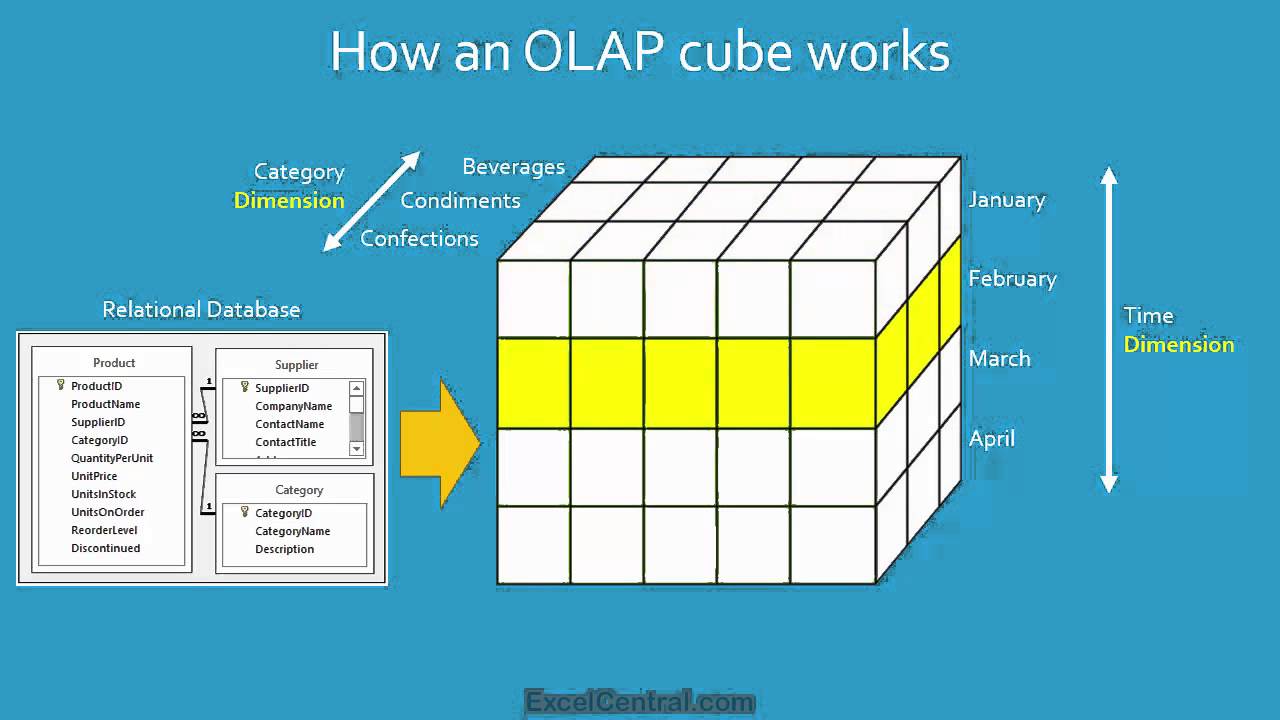
- Online Analytical Processing (OLAP)- a second type of reporting application, is more generic than RFM.
- Provides the ability to
- Sum
- Count
- Average
- Perform other simple arithmetic operations on groups of data
- Measure- is the data item of interest. The item that is to be summed or averaged or otherwise processed in the OLAP report.
- Examples: Total sales, average sales, and average cost
- Dimension- is a characteristic of a measure.
- Examples: Purchase data, customer type, customer location, and sales region.
- OLAP cube/Cube- some software products display OLAP by using three axes, like a cube in geometry.
- OLAP report- Same as OLAP cube
- Drill down- to further divide the data into more detail.


How Do Organizations Use Data Mining Applications?
- Data mining- is the application of statistical techniques to find patterns and relationships among data for classification and prediction. Sometimes people use the term, knowledge discovery in database (KDD) as a synonym for data mining.
- Unsupervised data mining- analysts do not create a model or hypothesis before running the analysis.
- Analysts create hypothesis after the analysis, in order to explain the patterns found.
- Cluster analysis- a common unsupervised technique. Statistical techniques identify groups of entities that have similar characteristics. Commonly used to find groups of similar customers from customer order and demographic data.
- Decision Tree- is a hierarchical arrangement of criteria that predict a classification or a value.
- Analyst sets up the computer program and provides the data to analyze, and the decision tree program produces the tree.
- Common business application: to classify loans by likelihood of default. Sometimes, financial institutions sell a group of loans to one another, loan portfolio.
- Decision Trees are easy to understand and easy to implement using decision rules. Sometimes organizations can use decision trees to select variables that are then used by other types of data mining tools.
- -Supervised data mining- data miners develop a model prior to the analysis and apply statistical techniques to data to estimate parameters of the model.
- Regression analysis- measures the effect of a set of variables on another variable.
- Neural networks- a popular supervised data mining application used to predict values and make classifications such as "good prospect" or "poor prospect" customers.

- Market-Based Analysis- is an unsupervised data mining technique for determining sales patterns.
- Shows the products that customers tend to buy together.
- Cross-selling- opportunity for marketing transactions " If they're buying X, sell them Y" or "If they're buying Y, sell them X."
- Support- is the probability that two items will be purchased together.
- Confidence- a conditional probability.
- Lift- the ratio of confidence to the base probability of buying an item.

How Do Organizations Use BigData Applications?
- BigData/ Big Data- is a term used to describe data collections that are characterized by huge volume, rapid velocity, and great variety.
- Generally BigData:
- Data sets are at least a perabyte in size, and usually larger.
- Is generated rapidly
- Has structured data, free-form text, log files, possibly graphics, audio, and video.
- MapReduce- is a technique for harnessing the power of thousands of computers working in parallel.
- Hadoop- is an open source program supported by the Apache Foundation that implements MapReduce on potentially thousands of computers.
- Pig- Hadoop's query language

How Is the Role of Knowledge Management Systems?
- Knowledge management (KM)- is the process of creating value from intellectual capital and sharing that knowledge with employees, managers, suppliers, customers, and others who need the capital.
- KM benefits organizations
- Improve Process Quality
- Increase Team Strength
- Modern KM ascribes to hyper-social organization theory.
- Expert systems- are rule-based systems that encode human knowledge in the form of If/Then rules.
- If/Then Rules- are statements that specify if a particular condition exists, then to take some action.
- Expert system shells- the programs that process a set of rules.

- Content Management Systems (CMS)- are information systems that support the management and delivery of documents including reports, Web pages, and other expressions of employee knowledge.
- Typical users of CMS are companies that sell complicated products and want to share their knowledge of those products with employees and customers.
- Challenges of Content Management
- Most content databases are huge.
- CMS content is dynamic.
- Documents do not exist in isolation from each other.
- Document contents are perishable.
- Content is provided in many languages.
- Content Management Application Alternatives
- In-house custom
- Off-the-shelf
- Public search engine

- Hyper-social knowledge management- is the application of social media and related applications for the management and delivery of organizational knowledge resources.
- Example: when an employee in customer support who writes a daily blog on current, common customer problems is expressing authentic opinions on the company's products, positive and possibly negative.
- If perceived as authentic- customers will comment upon blog entries and, in the process, teach others how they solved those problems themselves.
- Rich directory- is an employee directory that includes not only the standard name, email, phone, and address but also organizational structures and expertise.
- Particularly useful in large organizations where people with particular expertise are unknown.
- Employees can be reluctant to exhibit their ignorance.
- Fear of appearing incompetent, employees may not submit entries to blogs or discussion groups.
- Strategy: Provide a private media that can be acessed only by a smaller group of people who have an interest in a specific problem.
- Employee competition
- A hyper-social KM application may be ill-suited to a competitive group.
- The company may be able to restructure rewards and incentives to foster sharing of ideas among employees.
- Example: Giving a bonus to the group that develops the best idea.

What Are the Alternatives for Publishing BI?
- Static reports- are BI documents that are fixed at the time of creation and do not change.
- Example: Printed sales analysis
- Most static reports are published as PDF documents.
- Dynamic reports- are BI documents that are updated at the time they are requested.
- Example: Sales report that is current at the time the user accessed it on a Web server.
- Subscriptions- are user requests for particular BI results on a particular schedule or in response to particular events.
- Example: User subscribes to a daily sales report, requesting that it be delivered each morning.
- BI server- is a Web sever application that is purpose-built for the publishing of business intelligence.
- Most popular one: Microsoft SQL Server Report Manager (part of Microsoft SQL Server Reporting Services).
- Two major functions: management and delivery
- Today, the expectation is that BI results can be delivered to "any" device.
- In practice, "any" is interpreted to mean computers, smartphones, tablets, applications such as Microsoft Office, and SOA Web services.


Future in 2026?


Some companies will know more about your purchasing psyche than you, your mother, or your analyst.
- The Singularity- is the point at which computer systems become sophisticated enough that they can adapt and create their own software and hence adapt their behavior without human assistance.

This comment has been removed by the author.
ReplyDeleteGood content Surya Informatics
ReplyDelete